RightMark Audio Analyzer Test
These tests show the PIMETA v2.00 under various loads, as tested by RMAA PRO v6.2.3. Details below.
Summary
| 33 Ω load | 330 Ω load | no load | MOTU baseline | |
|---|---|---|---|---|
| Frequency response, dB | +2.05, -1.69 | +1.99, -1.64 | +1.99, -1.65 | +2.05, -1.69 |
| Noise level, dBA | -95.6 | -98.1 | -98.2 | -95.9 |
| Dynamic range, dBA | 95.8 | 98.6 | 98.6 | 96.0 |
| THD, % | 0.0019 | 0.0031 | 0.0028 | 0.0032 |
| IMD + Noise, % | 0.0064 | 0.0069 | 0.0066 | 0.0077 |
| Stereo crosstalk, dB | -94.4 | -96.8 | -98.1 | -95.7 |
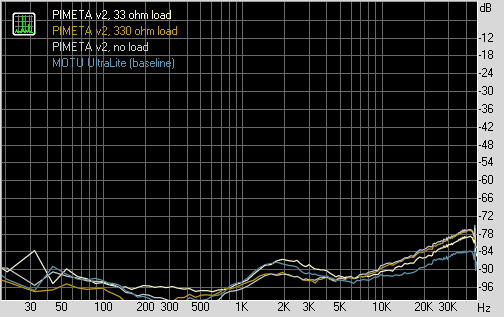
Frequency response
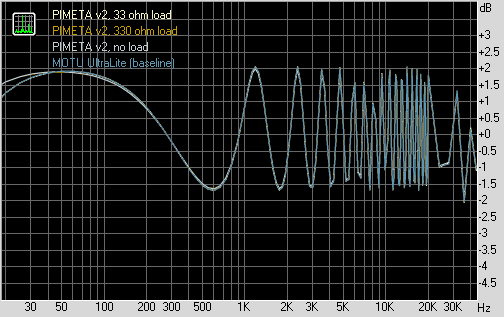
Ripple is from the source, not the amp. Details below.
Noise level
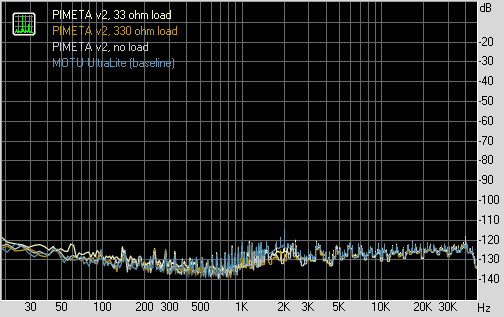
Sure is quiet in here...
Dynamic range
A little bump around 2 kHz, but quiet otherwise.
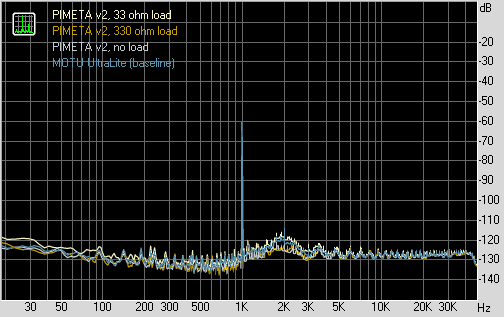
THD + Noise (at -3 dB FS)
Load? What load? Where?
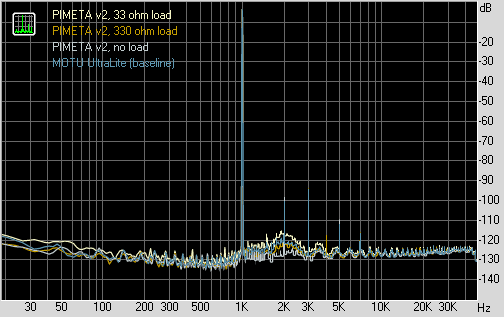
Intermodulation distortion
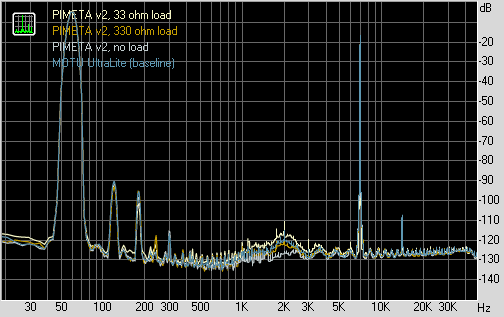
Nope, still don’t feel that load you claim to have added.
Stereo crosstalk
Kinda bogus. Details below.
Test Details
The primary test gear was a laptop connected to a MOTU UltraLite Firewire audio interface. The laptop was running on battery power and was powering the MOTU via Firewire. This floating test source configuration avoids AC line hum and ground loop issues.
The amp was connected to the MOTU box’s main outs via short ¼" to RCA jumpers. The amp’s output then went to a custom-built switch box that lifts the output ground, so as to avoid tying IG to OG through the test rig. (We’re thus running the PIMETA in “preamp mode,” using the test system’s audio ground rather than the ground channel.) The switch box also has two paralleled outputs: an RCA pair for connecting back to the MOTU’s analog 3&4 inputs via another set of short RCA to ¼" jumpers for recording the result, and a ¼" stereo jack for my headphone dummy load.
The dummy load is configured as described in that article. We thus have three PIMETA v2 tests: no load, 330 Ω load, and 33 Ω load. RMAA plots these against the MOTU looped back to itself in the graphs below.
The MOTU was run in 24-bit 96 kHz mode. Its internal mixer was configured so as to counteract the PIMETA’s gain, which was set to 2 for this test. This results in a somewhat higher noise floor as well as the ripple in the frequency response plots. That is, if we were to have run the MOTU without any attenuation, we’d have clipped the input signal, but the FR plots would be nice and flat. Alternately, we could have used the PIMETA’s volume control to reduce the incoming signal strength to counteract the system gain, but then we’d be showing bad crosstalk results. Since this method doesn’t show the PIMETA FR doing anythign that the MOTU itself isn’t doing, and the noise floor is still quite good, I chose this particular tradeoff.
The amp was powered from a YJPS v1.2 running at 24 V. This might sound like overkill, but it measurably helped the results. In particular, it got rid of some big 60 Hz and 180 Hz bumps in the noise floor plots that were added by my nice commercial bench supply. (Did I not say power supply quality matters?) This was connected to the PIMETA via a short 2-wire DC power jumper; we didn’t try to make use of the YJPS’s remote sensing feature for this test.
This space intentionally left blank. :)